Repo review · Tested October 6, 2026
visual-explainer trades speed for diagrams
A Claude Code skill for browser pages with code diagrams. Full mode took about eight times as long as a plain-text answer in our comparison.

The visual-explainer skill gives Claude Code, a coding agent, instructions for turning code explanations into browser pages with diagrams.
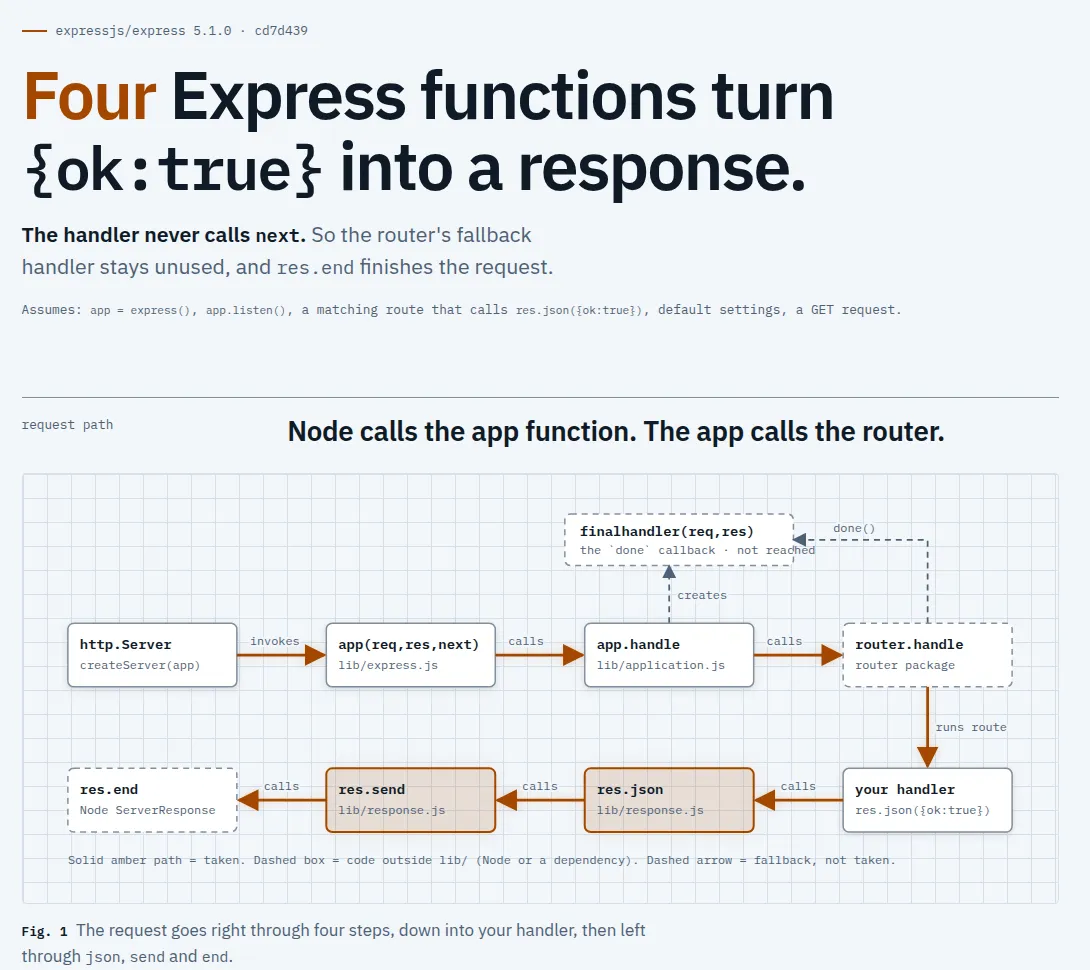
visual-explainer drew the path of one response through Express, a web framework. It took 104 seconds.
Full mode has Claude Code write the page and its diagrams from scratch. In our comparison, this used about 8.6× the output tokens (the units a model writes in, and what you wait for) and eight times the wait of a plain-text answer. visual-explainer’s --quick mode brought both down to about a quarter of full mode. Use full mode when the drawing earns the extra wait.
Tested: version 0.12.0, commit
6376b7727bb9b1d5d37ad3e4d96d969a6499917b, on October 6, 2026. Workflow: Claude Code with the Sonnet 5.5 model answered ten questions twice in five formats. Result: visual-explainer’s full mode used more output and time than a plain-text answer; quick mode reduced both. Verdict: adopt with care for custom diagrams you will inspect.
Install visual-explainer and name the skill in your prompt
The visual-explainer README gives these Claude Code installation commands:
/plugin marketplace add nicobailon/visual-explainer
/plugin install visual-explainer@visual-explainer-marketplace
Then ask about the code you want explained. The prompt behind the Express diagrams named the functions to trace:
Explain the path from Node HTTP into app.handle and router.handle, then the handler through res.json, res.send and res.end.The full prompt also listed what the page had to cover, such as the fallback handler and how request and response objects get their methods.
Every page shown here was made by naming the skill in the prompt. Ask for it the same way:
Use the visual-explainer skill.The documented output path is:
~/.agent/diagrams/<descriptive-name>.htmlYou can request another destination. visual-explainer is MIT-licensed and pre-1.0; the README says ordinary page generation needs no build step.
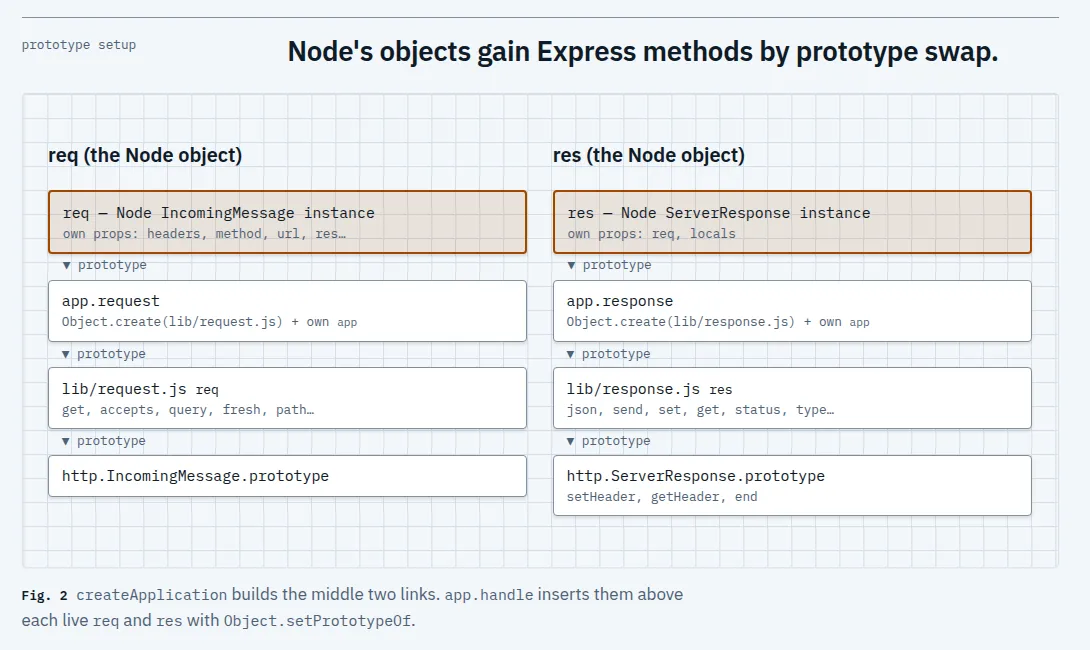
Asked to trace a response through Express, visual-explainer drew where the request and response methods come from.
visual-explainer’s full mode used more tokens and time than a plain-text answer
The comparison includes answer-me-with-html, a skill that has the agent write a Markdown draft and a bundled renderer build the page. The “HTML without a skill” format asks Claude Code to answer as a web page. Each format answered the same ten questions twice: five general computing questions and five about Express.
Before running anything, we wrote a checklist of facts each answer should contain, 204 across the twenty answers per format, and counted how many turned up. The count is a text match, and many of the facts restate the question, so it did not separate the formats; read it as a sanity check, not a ranking. Output tokens include Sonnet 5.5’s reasoning. Each median covers twenty answers.
| Answer format | Median output tokens | Median seconds | Checklist facts found |
|---|---|---|---|
| Plain-text answer | 1,900 | 13.8 | 190/204 |
| HTML without a skill | 4,453.5 | 28.9 | 194/204 |
| visual-explainer, full | 16,317 | 109.9 | 190/204 |
visual-explainer, --quick |
4,093 | 30.1 | 194/204 |
| answer-me-with-html | 2,879.5 | 24.4 | 180/204 |
The checklist did not separate full mode from a plain-text answer. The wait did: full mode took about eight times as long. Against asking Claude Code for HTML with no skill at all, it used about 3.7 times the output tokens. Here is the usage record for the Express page in the first screenshot (num_turns counts the agent’s steps, duration_ms is milliseconds):
"output_tokens":15438
"num_turns":4
"duration_ms":104175
That is 104 seconds for one answer. The diagrams are good; they are not quick.
Quick mode uses fewer tokens than full mode
Quick mode asks the agent for a compact JSON description of the page and lets a bundled renderer build it. The main README’s example is:
/generate-web-diagram --quick authentication request flowFor the quick-mode Express page, the prompt said:
Use the visual-explainer skill with /generate-web-diagram --quick.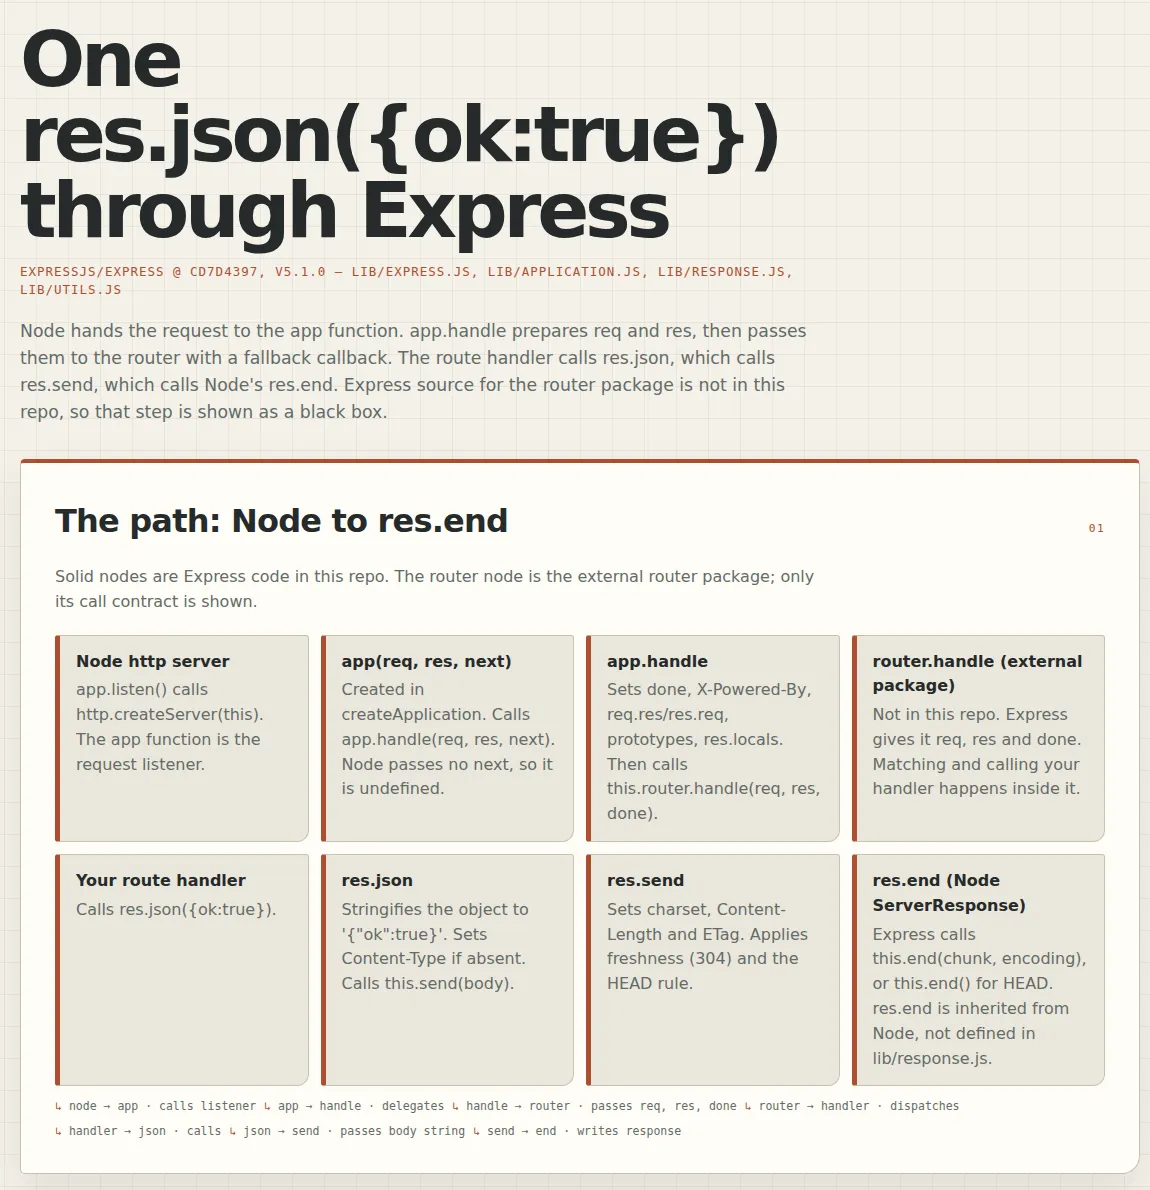
visual-explainer’s quick mode traced an Express JSON response with cards and a text list of connections.
The renderer built all twenty quick-mode pages. Fed five deliberately broken page descriptions, it rejected four with a clear message and rendered the fifth, an absurdly long label, without overlap.
answer-me-with-html was the fastest page format
The answer-me-with-html skill used the fewest output tokens and was the fastest of the page formats. Its checklist count was the lowest, and at least one of those misses was a correct answer our text match failed to recognise in a list, so treat that gap as unproven.
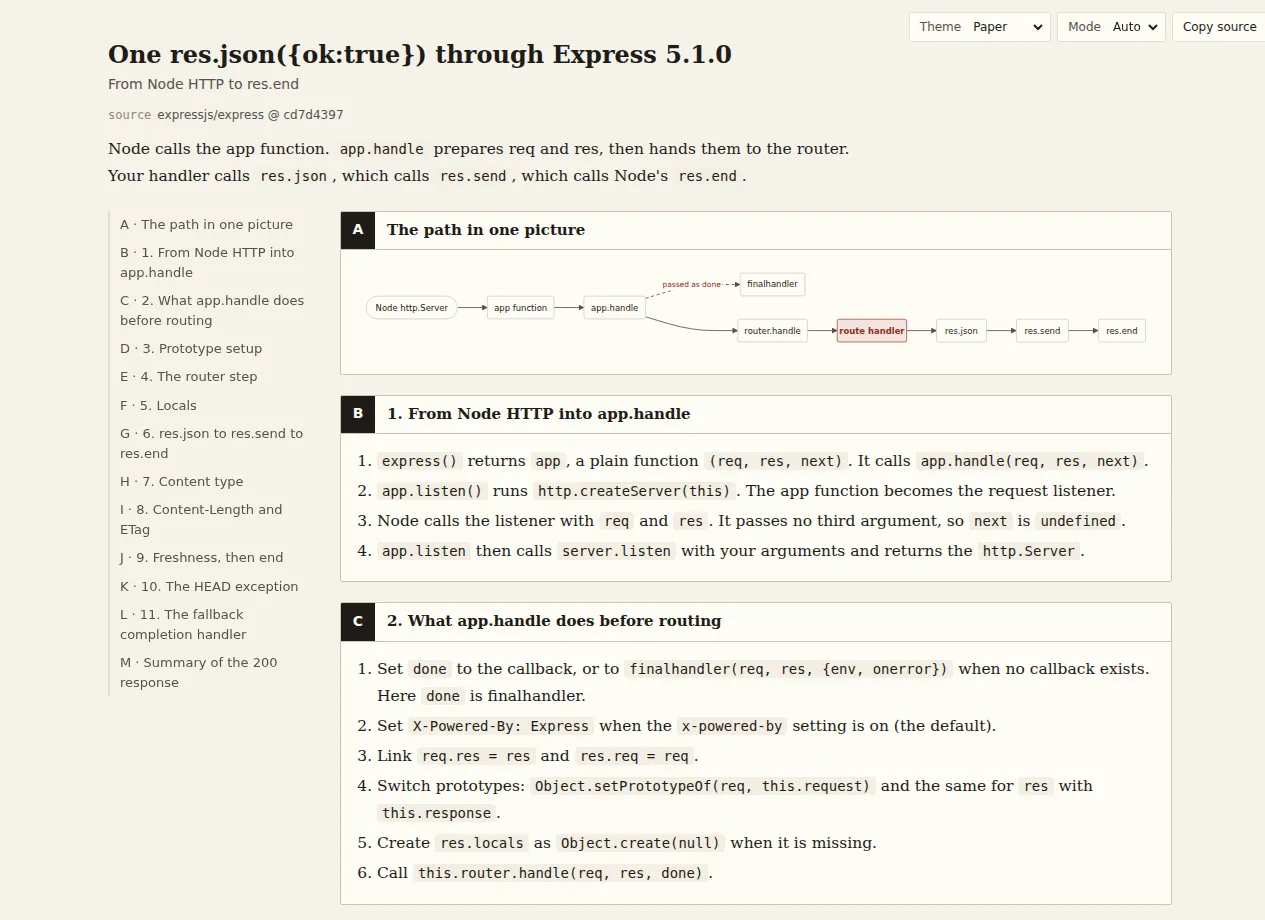
The answer-me-with-html skill traced an Express JSON response with a compact flow diagram, section navigation and numbered explanations.
The html-plan plugin, from Anthropic’s community plugin marketplace, does a different job: a page where you can respond to proposed implementation decisions. Across three planning tasks repeated twice, its medians were 10,753 output tokens and 75.3 seconds, against visual-explainer’s 18,389.5 and 114.6. Those numbers show how much each wrote and how long it took, not whether the plans were right.
Look over visual-explainer’s diagrams before sharing
On all twenty full-mode pages, the agent wrote the diagrams itself in SVG, a browser image format, without the diagram generator Mermaid or a charting library. Four pages had step-through controls and six had highlighting that links text to a diagram when you hover; the Express page in the first screenshot has neither. Only the presence of these controls is verified, not their behavior when clicked or hovered.
An automated check flagged possible label overlap or clipping on twelve of the twenty full-mode pages; a flag is a measurement, not proof that a page is hard to read. One defect you can see for yourself is in that first screenshot’s diagram: “the done callback · not reached” runs past the right edge of its dashed box. The label says “not reached”; the label itself went further. Try a follow-up prompt: name the label and ask for the box to be widened. Look the page over at the size you will share it before you send it to anyone.
Adopt visual-explainer with care for custom diagrams
Adopt visual-explainer with care if you use Claude Code and need custom diagrams enough to wait for them and inspect them. If a label overflows its box, name it and ask for the box to be widened. Use --quick when you want a structured page and not a drawing: it used about a quarter of full mode’s output tokens. Stay with a plain-text answer when you only need the explanation; the median one took 14 seconds.
What would change this: a release that brings full mode’s wait close to quick mode’s for the same question.